
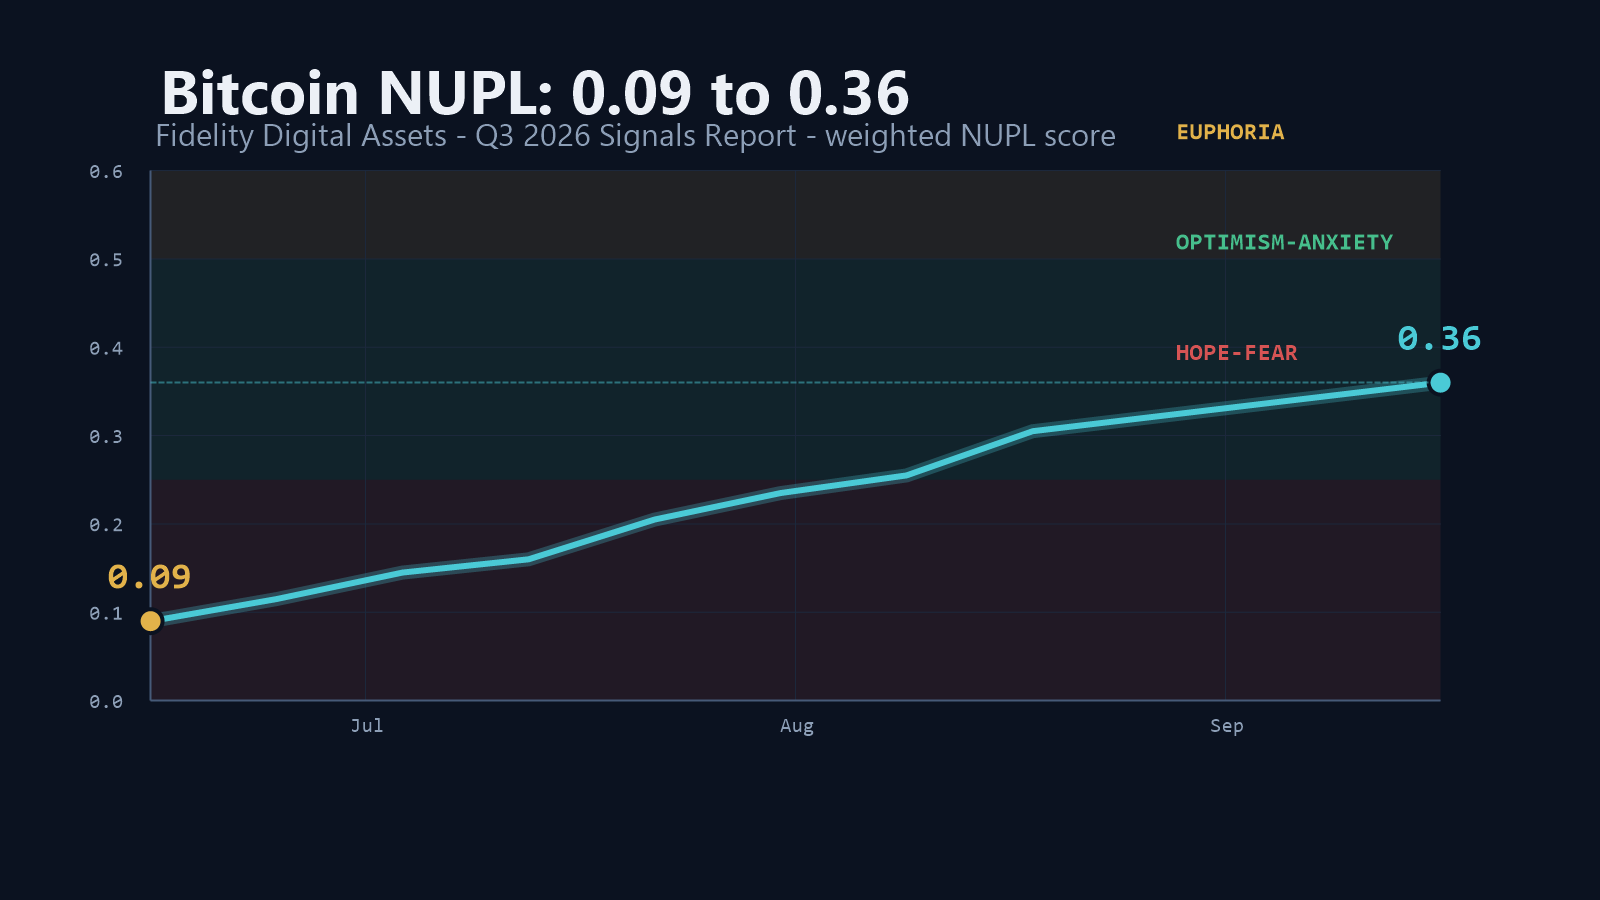
On-chain analysts have spent years trying to build a thermometer for Bitcoin sentiment. Fidelity Digital Assets has just taken the reading, and the number is notable: Bitcoin's Net Unrealized Profit/Loss score rose from 0.09 at the end of Q2 2026 to 0.36 by the close of Q3, according to the firm's Q4 2026 Signals Report, published on 28 October.
That is a substantial move. It is also the kind of number that travels quickly through crypto media, so it is worth taking it apart before deciding what to do with it.
Key Takeaways
- Bitcoin's weighted NUPL score rose from 0.09 to 0.36 during Q3 2026.
- BTC gained roughly 43% over the same period and traded between $61,438 and $86,505.
- Holders now sit on an estimated $627 billion in unrealized gains, with Bitcoin trading about 45% above aggregate cost basis.
- Fidelity's historical sample of similar readings (439 observations) shows a median one-year return of 93% and a three-year CAGR of 37%.
- Fidelity itself cautions that historical relationships may weaken or fail to persist.
What NUPL Actually Measures
NUPL, or Net Unrealized Profit/Loss, is one of the more conceptually straightforward on-chain metrics in circulation. NUPL measures the difference between Bitcoin's market capitalisation and its realised capitalisation, divided by market capitalisation. Realised capitalisation estimates the value of coins based on their last on-chain movement, making it a useful but imperfect proxy for aggregate cost basis.
In plain terms: when NUPL is high, Bitcoin holders are collectively sitting on large paper gains. When it drops below zero, the average holder is underwater. A positive NUPL indicates aggregate unrealised profitability, but does not mean every investor is in profit.
The metric is widely used to segment market sentiment into distinct sentiment regimes, ranging from capitulation and fear at the bottom through a middle band of hope and anxiety, into zones of optimism and euphoria at the top. For much of Q2 2026, a NUPL reading of 0.09 placed Bitcoin firmly in the lower band. By the end of Q3, at 0.36, it had moved decisively into the middle-to-upper zone.
It is worth being precise about what this does and does not tell you. NUPL measures aggregate unrealised position, not investor behaviour. It cannot tell you who is holding, on what timeframe, or with what conviction - and it is notoriously imprecise as a timing tool.
The Historical Claim, and Why It Needs Context
The headline figure people are circulating comes from Fidelity's own research: "Historically, periods when BTC's NUPL score hovered around 0.36 (plus or minus 0.05) have coincided with a median one-year return of 93% and a three-year CAGR of 37%, based on over 439 total observations."
On its face, that is a striking statistical observation. A 93% median one-year return would be exceptional in any asset class.
There are three contextual points that should travel with it.
First, this is a median, not a guarantee. A median describes the middle of a distribution. Some instances in that sample were surely negative, and some were surely far better than 93%. The statistic says nothing about what happened in any given instance after a reading of 0.36 - it only describes what the typical outcome looked like historically.
Second, the sample is small in a specific sense. 439 observations sounds substantial until you consider that Bitcoin's entire price history is roughly fifteen years old, and that the NUPL metric itself requires reliable on-chain cost-basis data. The effective number of independent, non-overlapping periods in that sample is far smaller than 439 suggests, and overlapping periods tend to cluster, which inflates apparent statistical significance.
Third, the regime has changed. Bitcoin in 2026 trades in institutional flows, spot ETF liquidity, and derivatives markets that did not exist in 2013. Fidelity's own research team flagged this directly: "historical relationships may weaken or fail to persist, and outcomes should be evaluated within the broader macro and market context." That is a more useful sentence than the 93% figure.
The Other Signals in the Same Report
The NUPL reading did not arrive alone, and the supporting signals are more informative than any single metric.
Momentum. Fidelity's momentum signal has been positive since 24 August, and Bitcoin has gained roughly 8% since that date. Volatility ticked up notably following the mid-August Treasury buyback announcement.
Moving averages. Bitcoin moved above its 50-day and 200-day moving averages during September, signalling improving price momentum. A conventional golden cross would require the 50-day moving average itself to cross above the 200-day moving average; that separate technical condition should be confirmed before applying the label.
Price structure. Bitcoin traded between $61,438 and $86,505 across Q3. At the time of reporting, BTC was around $80,000.
Fidelity was careful about how it framed all of this. As the research team put it, the signal "is not designed to identify precise tops or bottoms." That is the correct framing for any sentiment metric that measures positioning rather than price action.
Where This Leaves the Market
The bull case, stated fairly: a major asset manager's research arm has identified what it regards as a historically constructive zone, momentum has turned, and the technical structure has improved simultaneously. Bitcoin has also historically delivered corrections of 20-35% within larger bull markets, which makes a pullback from current levels unremarkable in isolation.
The bear case, stated equally fairly: NUPL at 0.36 means holders are sitting on substantial paper gains, and realised profit tends to create supply. A move back below the 0.25 boundary would mark weakening aggregate unrealised profitability and undo much of what the quarter built. Layered on top of that, Bitcoin increasingly trades as a high-beta risk asset, and it has not been insulated from equity market stress.
Key levels to watch:
- Support: $74,000, $68,000 and $61,000
- Resistance: $86,500 and the $100,000 psychological level
- NUPL: 0.25 as the line between Optimism-Anxiety and Hope-Fear
Our Outlook
At XavierFinans, we read the NUPL print as confirmation that Bitcoin's Q3 recovery had genuine on-chain support, rather than as a forecast. A sentiment regime shift that coincides with positive momentum and a golden cross is more meaningful than any one of the three in isolation.
What it is not is a reason to ignore position sizing, macro conditions, or the fact that a 93% median historical return describes a distribution rather than a destination. The score improved. That is a fact about the past quarter, not a promise about the next one.
A sustained NUPL reading above 0.25 would be consistent with the market remaining in the Optimism-Anxiety regime. A move below that threshold, however, would indicate weakening aggregate unrealised profitability rather than independently confirming a bearish reversal. Price structure, liquidity and broader market conditions would still need to be considered.
Disclaimer
This article is for informational and educational purposes only and should not be considered investment advice. Cryptocurrency investments are highly volatile and involve significant risk. Past performance and historical statistical relationships do not guarantee future results. Investors should conduct their own research and consult qualified financial advisors before making investment decisions.
Sources
- Fidelity Digital Assets, Signals Report Q3 2026 (published 28 October 2026)
- Bitcoin Magazine, reporting on the Fidelity NUPL findings
- Glassnode and CryptoQuant methodology documentation for NUPL